


One of the strong solutions to help reduce air pollution in cities and towns is the switch to electric cars. Electric vehicles have no exhaust, which means there are no polluting greenhouse gases and they can also be charged with electricity generated from renewable sources like wind and solar. We wanted to show why switching to electric is so important when it comes to protecting the quality of the air we breathe in cities.
To illustrate which cities have the lowest levels of air pollution around the world, we used Open Weather Map data to record the air particle concentrations in 393 global cities at six-month intervals since February 2021. Our analysis reveals the cities with the cleanest air across the world's continents, as well as which cities' concentration of toxic air pollutants have improved the most in the last three years.
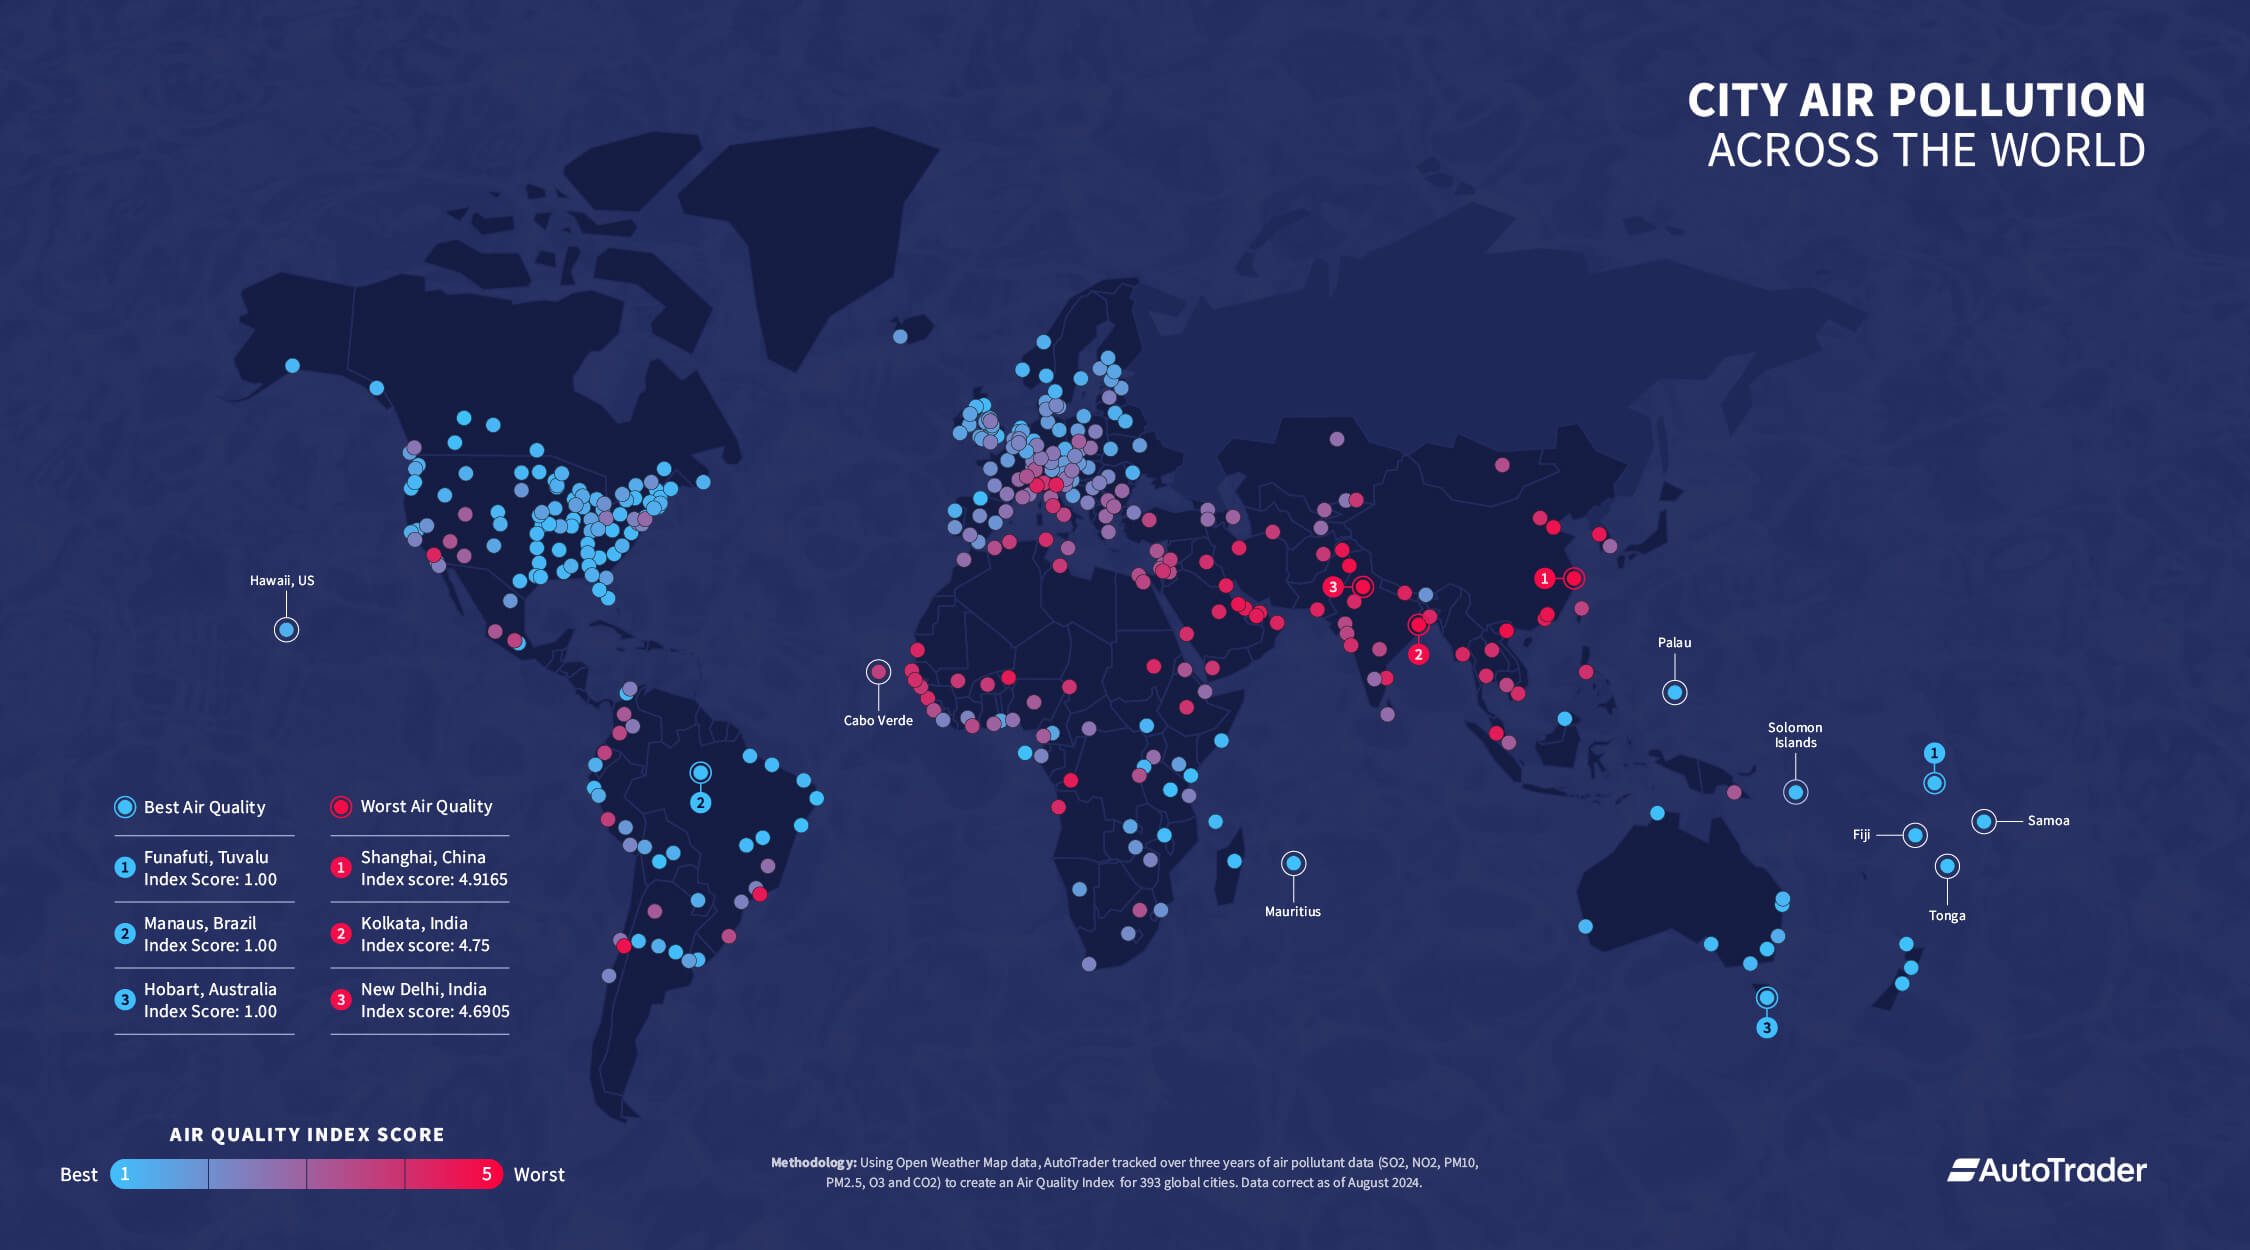
The study found that Australia and other Oceanic countries are home to cities with the cleanest air. The cities with the lowest concentration levels of these pollutants include Australia's Hobart, Darwin and Canberra, as well as New Zealand's Wellington, and Samoa's Apia.
In the UK, the city with the least amount of air pollution is Scotland's Edinburgh, followed by Manchester - and then London.
When it comes to improving air pollution levels over the past four years, the winners are dispersed all over the world, with cities in Africa, Asia and Europe all featuring in the top ten. Big air pollution improvers include Italy's Naples, Tbilisi in Georgia and Cambodia's Phnom Penh.
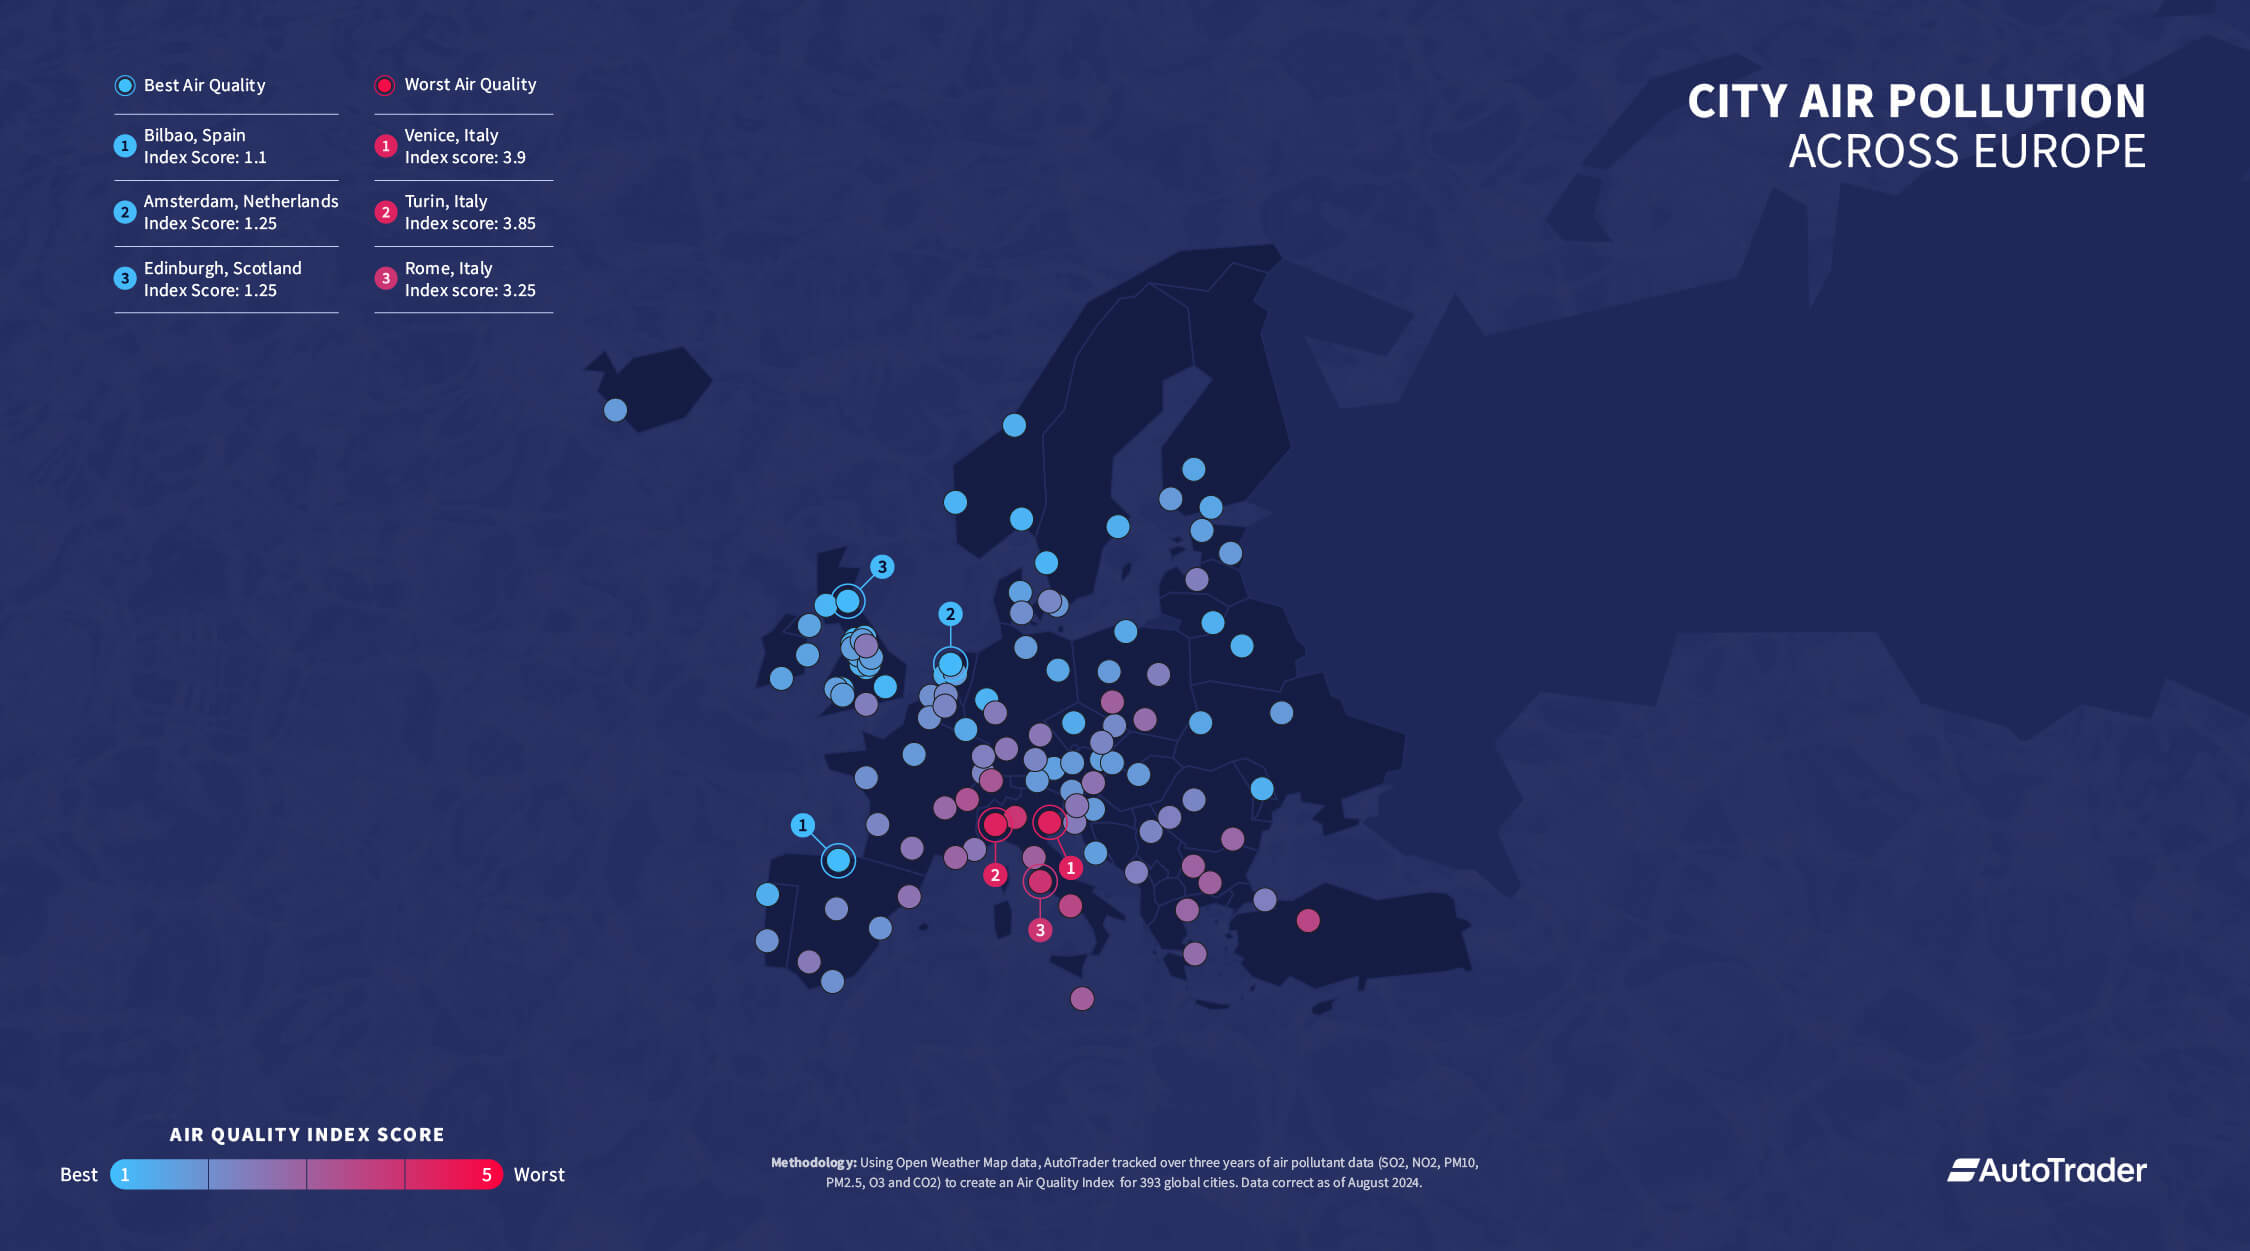
Spain's Bilbao comes out as the city with the best Air Quality Index score in Europe, followed by Amsterdam in the Netherlands and the UK's own Edinburgh.
Bilbao ranks as Europes cleanest city when it comes to air pollutants. The Spanish city has undergone a dramatic transformation; once a heavily polluted city thanks to its history in steelworks, Bilbao's economy is now much more driven by the service industry. Bilbao also benefits from a fantastic public transport system, which massively contributes to less urban air pollution from private vehicles. The city has also invested in changing the city's council vehicles to electric and has incentivised taxi and delivery fleets to make the switch to electric.
The prevalent cycling culture in Amsterdam means that its vehicle emissions are significantly lower than other urban capitals in Europe. The city also has Low-Emissions Zones (LEZ) with strict emission standards, a thriving public transport network, thousands of charging stations for electric cars and incentives for the city's electric car drivers.
Scandinavian cities also feature in Europe's top ten cleanest air charts, with Bergen, Oslo and Gothenburg all ranking highly. Germany's Cologne takes the tenth spot thanks to its investment in renewable energy sources across the city, including solar panels and wind energy as well as fostering a strong culture of environmental awareness among its citizens.
| City | Country | Air Quality Index | |
|---|---|---|---|
| #1 | Bilbao | Spain | 1.1 |
| #2 | Amsterdam | Netherlands | 1.25 |
| #3 | Edinburgh | Scotland | 1.25 |
| #4 | Manchester | England | 1.25 |
| #5 | Bergen | Norway | 1.3 |
| #6 | Oslo | Norway | 1.3 |
| #7 | London | England | 1.35 |
| #8 | Gothenburg | Sweden | 1.38 |
| #9 | Glasgow | Scotland | 1.38 |
| #10 | Cologne | Germany | 1.4 |
Edinburgh's coastal location means the ocean air helps disperse pollutants naturally, but the Scottish capital also has relatively low levels of heavy industry, an effective public transport network, lots of green spaces acting as a natural filtration system and Low-Emission Zones all working together to earn it the title of the UK's Cleanest Air City.
Manchester is the city with the lowest concentration of harmful air pollutants in England, thanks to its transition to a more service-oriented economy, its Clean Air Zones (CAZ), its investment in the Bee Network (comprising bus, tram, cycling and walking routes) and regular rainfall and winds helping disperse air pollutants.
Initiatives such as the Congestion Charge, LEZ and ULEZ have all helped contribute to London's lower concentrations of air pollutants, as does the fact the UK capital is considered an ;'urban forest' due to the millions of trees in the city, which play a vital part in cooling the city and sequestering its carbon emissions. London has invested heavily in its electric car charging network, as well as promoting green roofs and other energy-efficient measures in its new buildings.
Cardiff in Wales also features in the UK's top ten cleanest air cities. Its low levels of harmful air particles is in part due its lower population density, location near the coast and Bristol Channel, and large parks like Bute Park, Roath Park and the Cardiff Bay Wetlands Reserve acting as natural pollution filters, but it's also thanks to the Welsh government and Cardiff City Council promoting electric car travel and better energy efficiency in homes and businesses.
| City | Country | Air Quality Index | |
|---|---|---|---|
| #1 | Edinburgh | Scotland | 1.25 |
| #2 | Manchester | England | 1.25 |
| #3 | London | England | 1.35 |
| #4 | Glasgow | Scotland | 1.38 |
| #5 | Coventry | England | 1.43 |
| #6 | Birmingham | England | 1.45 |
| #7 | Liverpool | England | 1.45 |
| #8 | Leeds | England | 1.48 |
| #9 | Cardiff | Wales | 1.55 |
| #10 | Stoke | England | 1.58 |
For this report we created an Estimated Index Change which shows how much the Air Quality Index score of a city has improved or worsened over the four years we tracked. Two cities in Africa, Eritrea and Freetown came out on top, with European entries in the top ten including Austria's Klagenfurt and Italy's Naples.
| City | Country | % Change of particulates (4 years) |
Est. Index change (4 years) |
|
|---|---|---|---|---|
| #1 | Asmara | Eritrea | -53% | -2.811 |
| #2 | Freetown | Sierra Leone | -53% | -2.796 |
| #3 | Surat | India | -52% | -2.375 |
| #4 | Tbilisi | Georgia | -79% | -2.288 |
| #5 | Nouakchott | Mauritania | -59% | -2.268 |
| #6 | Phnom Penh | Cambodia | -66% | -2.263 |
| #7 | Bissau | Guinea-Bissau | -29% | -2.261 |
| #8 | Klagenfurt | Austria | -79% | -2.216 |
| #9 | Abuja | Nigeria | -72% | -2.263 |
| #10 | Naples | Italy | -85% | -2.150 |
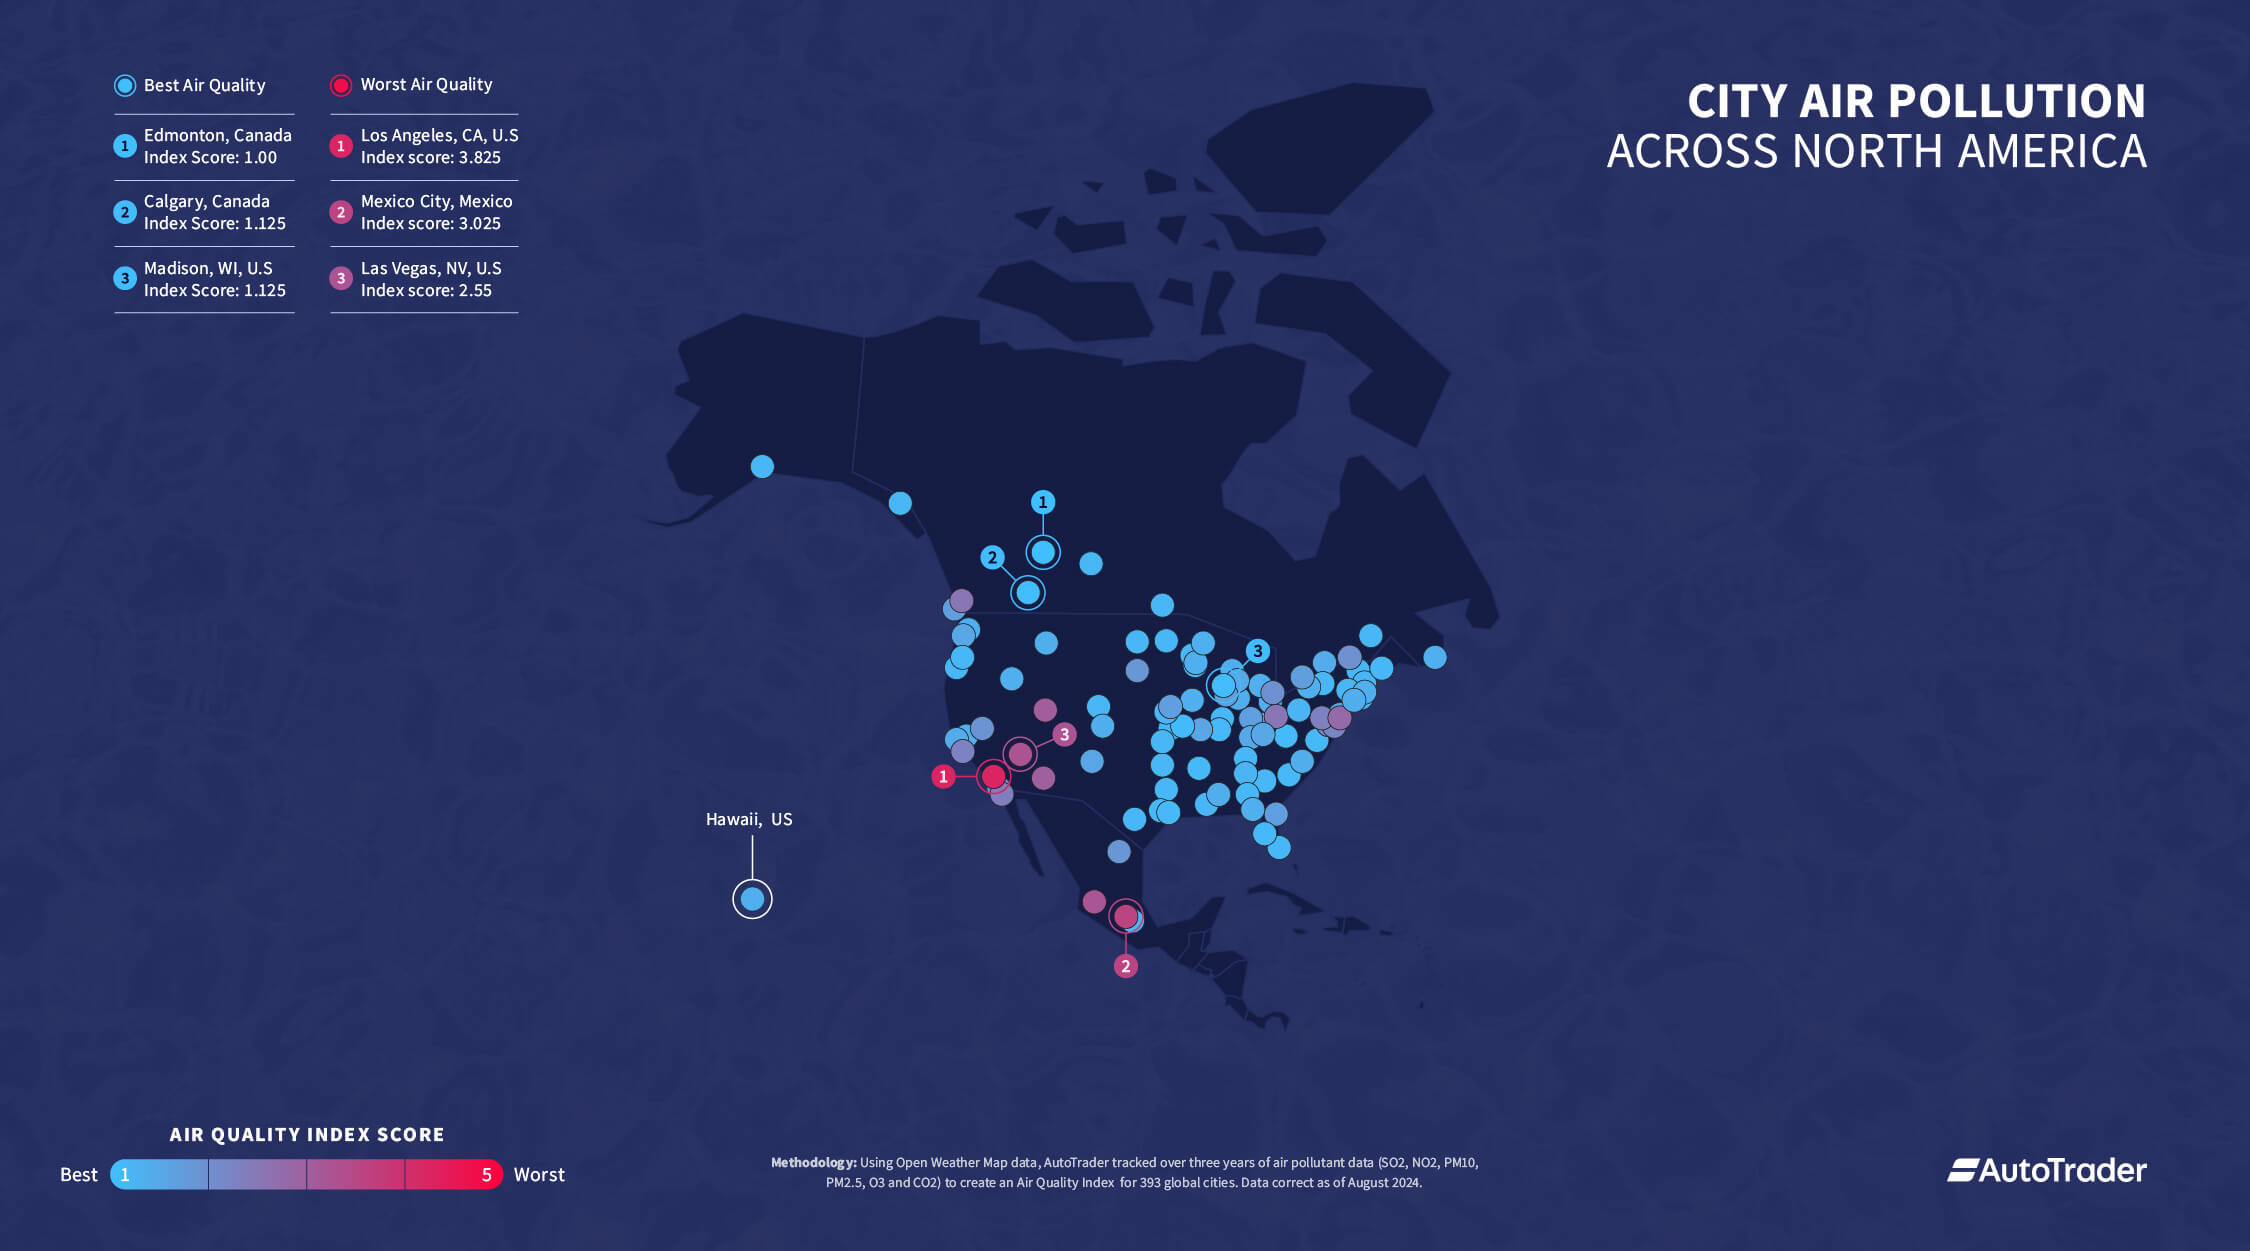
Calgary, another city in Alberta, also benefits from Canada's strict enforcement of emission limits on vehicles, as well as its location near the Rocky Mountains and the region's transition to renewable sources. The Canadian cities are followed by the United States' Madison in Wisconsin, which matches Calgary's Air Quality Index score of 1.3*. Madison's high Midwest winds help to naturally remove air pollutants, and the city has committed to achieving 100% renewable energy for operations; its investment in electric vehicle charging infrastructure and promotion of electric car adoption have also all helped contribute to making Madison the city with the cleanest air in the USA.
*(Cities tying with an Air Quality Index score have been sub-ranked by tallying the concentration of the city's pollutants; in this case Calgary slightly outperforms Madison. See more in the Methodology below).
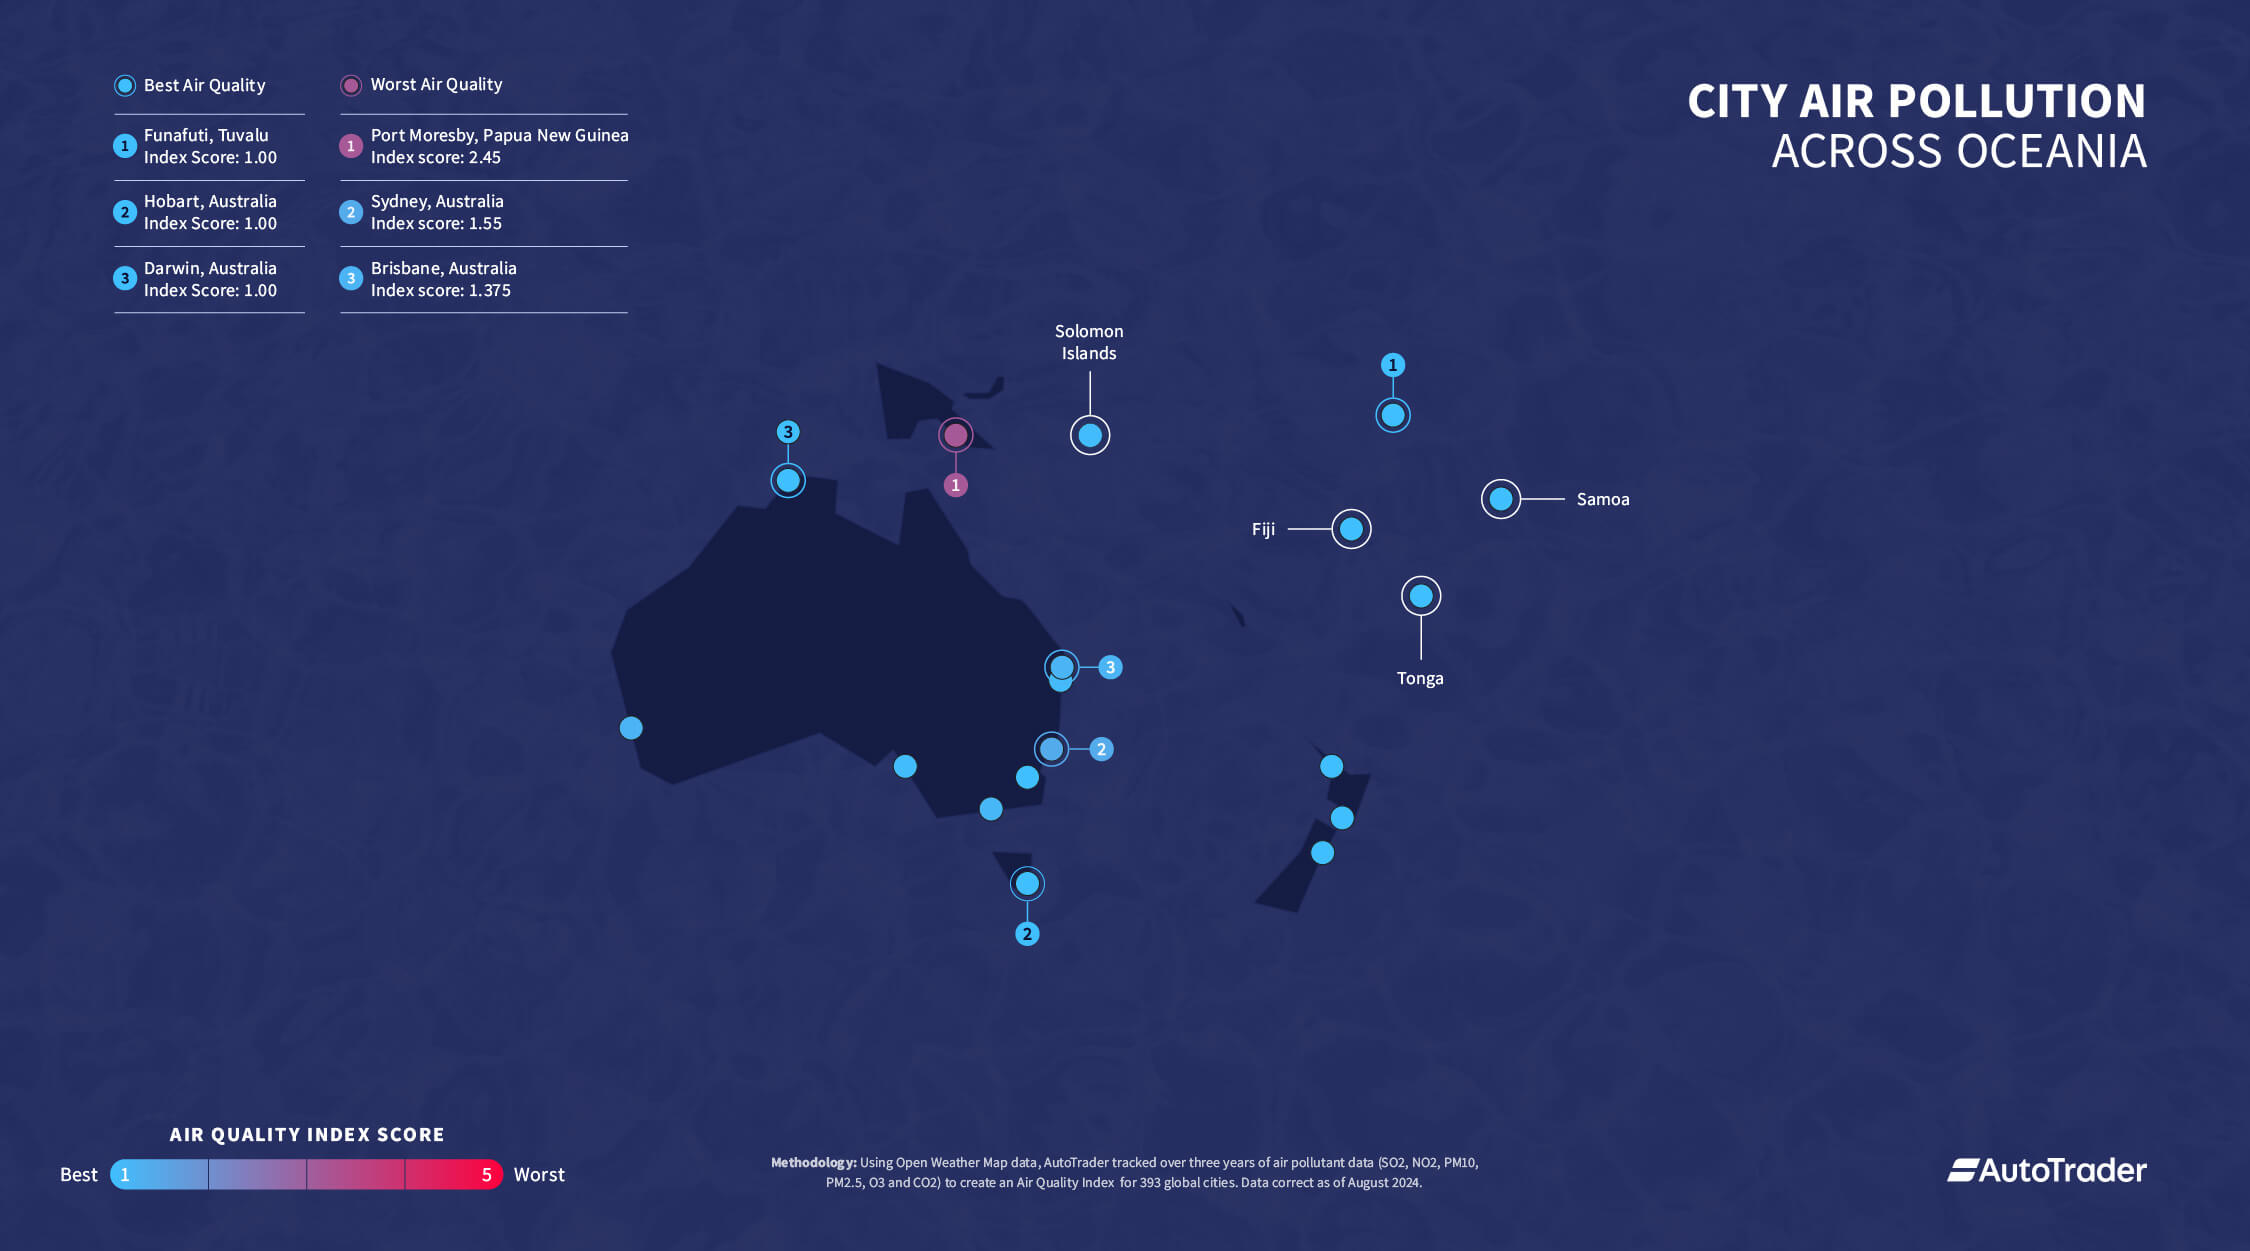
The continent of Oceania is home to ten of the world's top 20 cleanest air cities, with the top five including Funafuti, Hobart, Darwin, Apia and Nuku'alofa. The world's cleanest air city is Funafuti in Tuvalu; Tuvalu is at severe risk of rising sea levels, and the country has garnered international recognition for its advocacy of measures which will limit climate change.
Australia, another country that has shouldered the strain of climate change, is also home to two of the world's cleanest air cities, Hobart and Darwin. Both cities are close to the ocean (Hobart is on the southeast coast of Tasmania and Darwin is on the north coast facing the Timor Sea), and both benefit from a small city population and low traffic levels. The city with the cleanest air in New Zealand is Wellington. Known as 'Windy Wellington' the natural high winds help shift toxic air pollutants out of the city, but the city's structure, which has controlled urban 'sprawling, also means all citizens live close to their working spaces or can easily reach them on public transport.
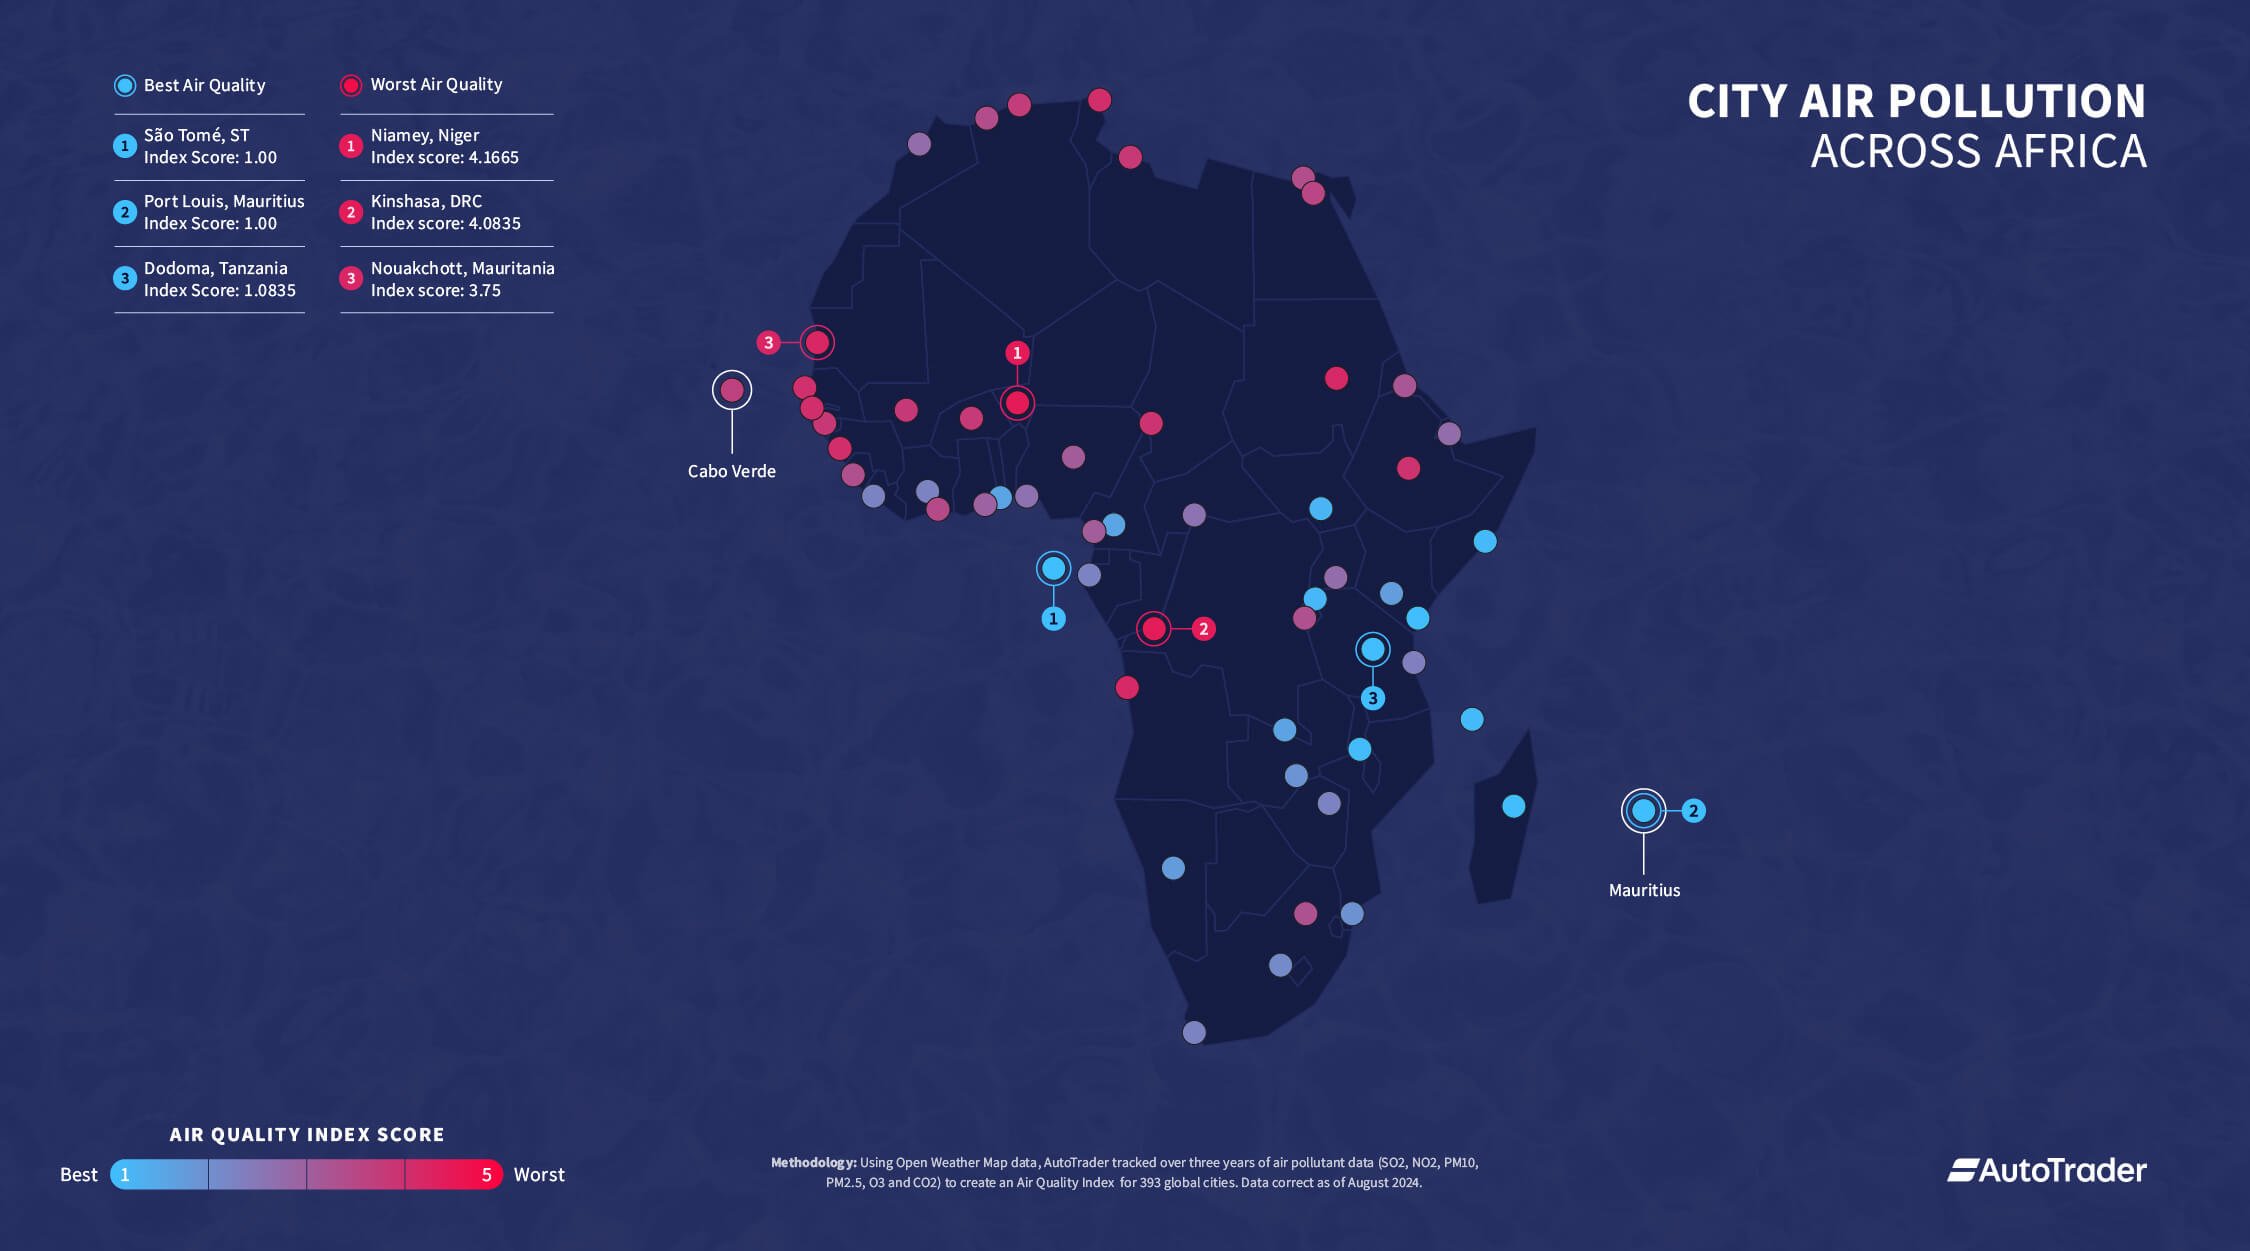
In Africa, the top five cleanest-air cities are found in São Tomé, Mauritius, Tanzania, Madagascar and Kenya. The ocean breezes on the islands of São Tomé and Príncipe and Mauritius contribute to keeping the air pollution in São Tomé and Port Louis very low. Tanzania's Dodoma is located inland but has low traffic congestion and a small population compared to other major African cities; the city also has a focus on agriculture rather than heavy industry, and Dodoma lacks the large-scale factories and manufacturing plants that are present in high-polluting cities.
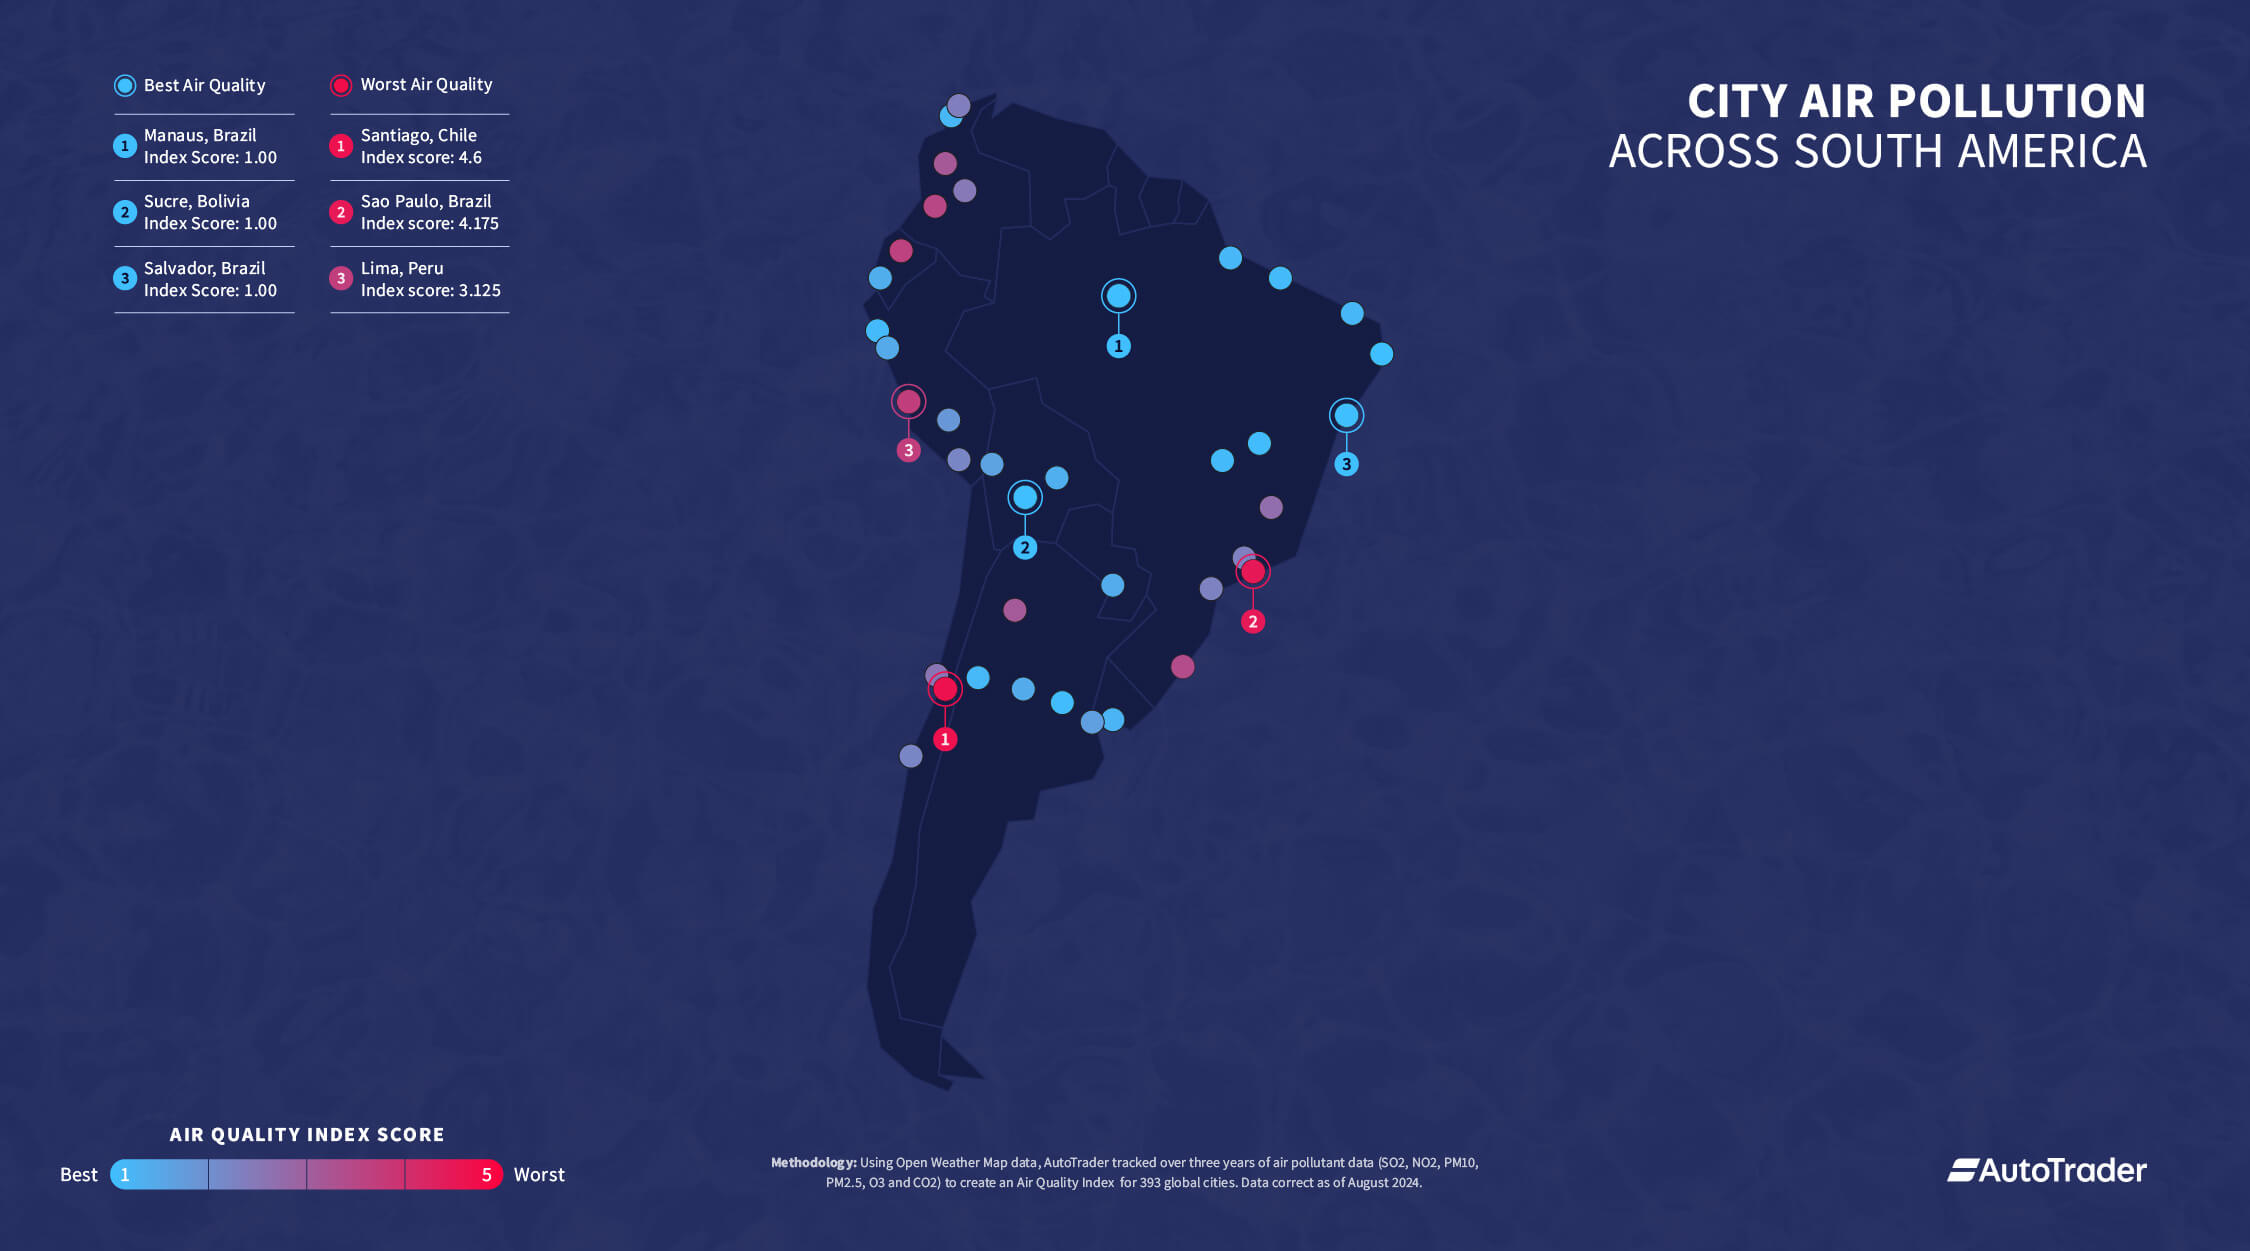
Four of South America's cleanest air cities are found in Brazil: Manaus, Recife, Salvador and Brasília. Brazil's cleanest-air cities either benefit from a coastal location (like Salvador) or are cities in the inland Amazon region, such as Manaus, which benefit from vast forests providing natural air purification.
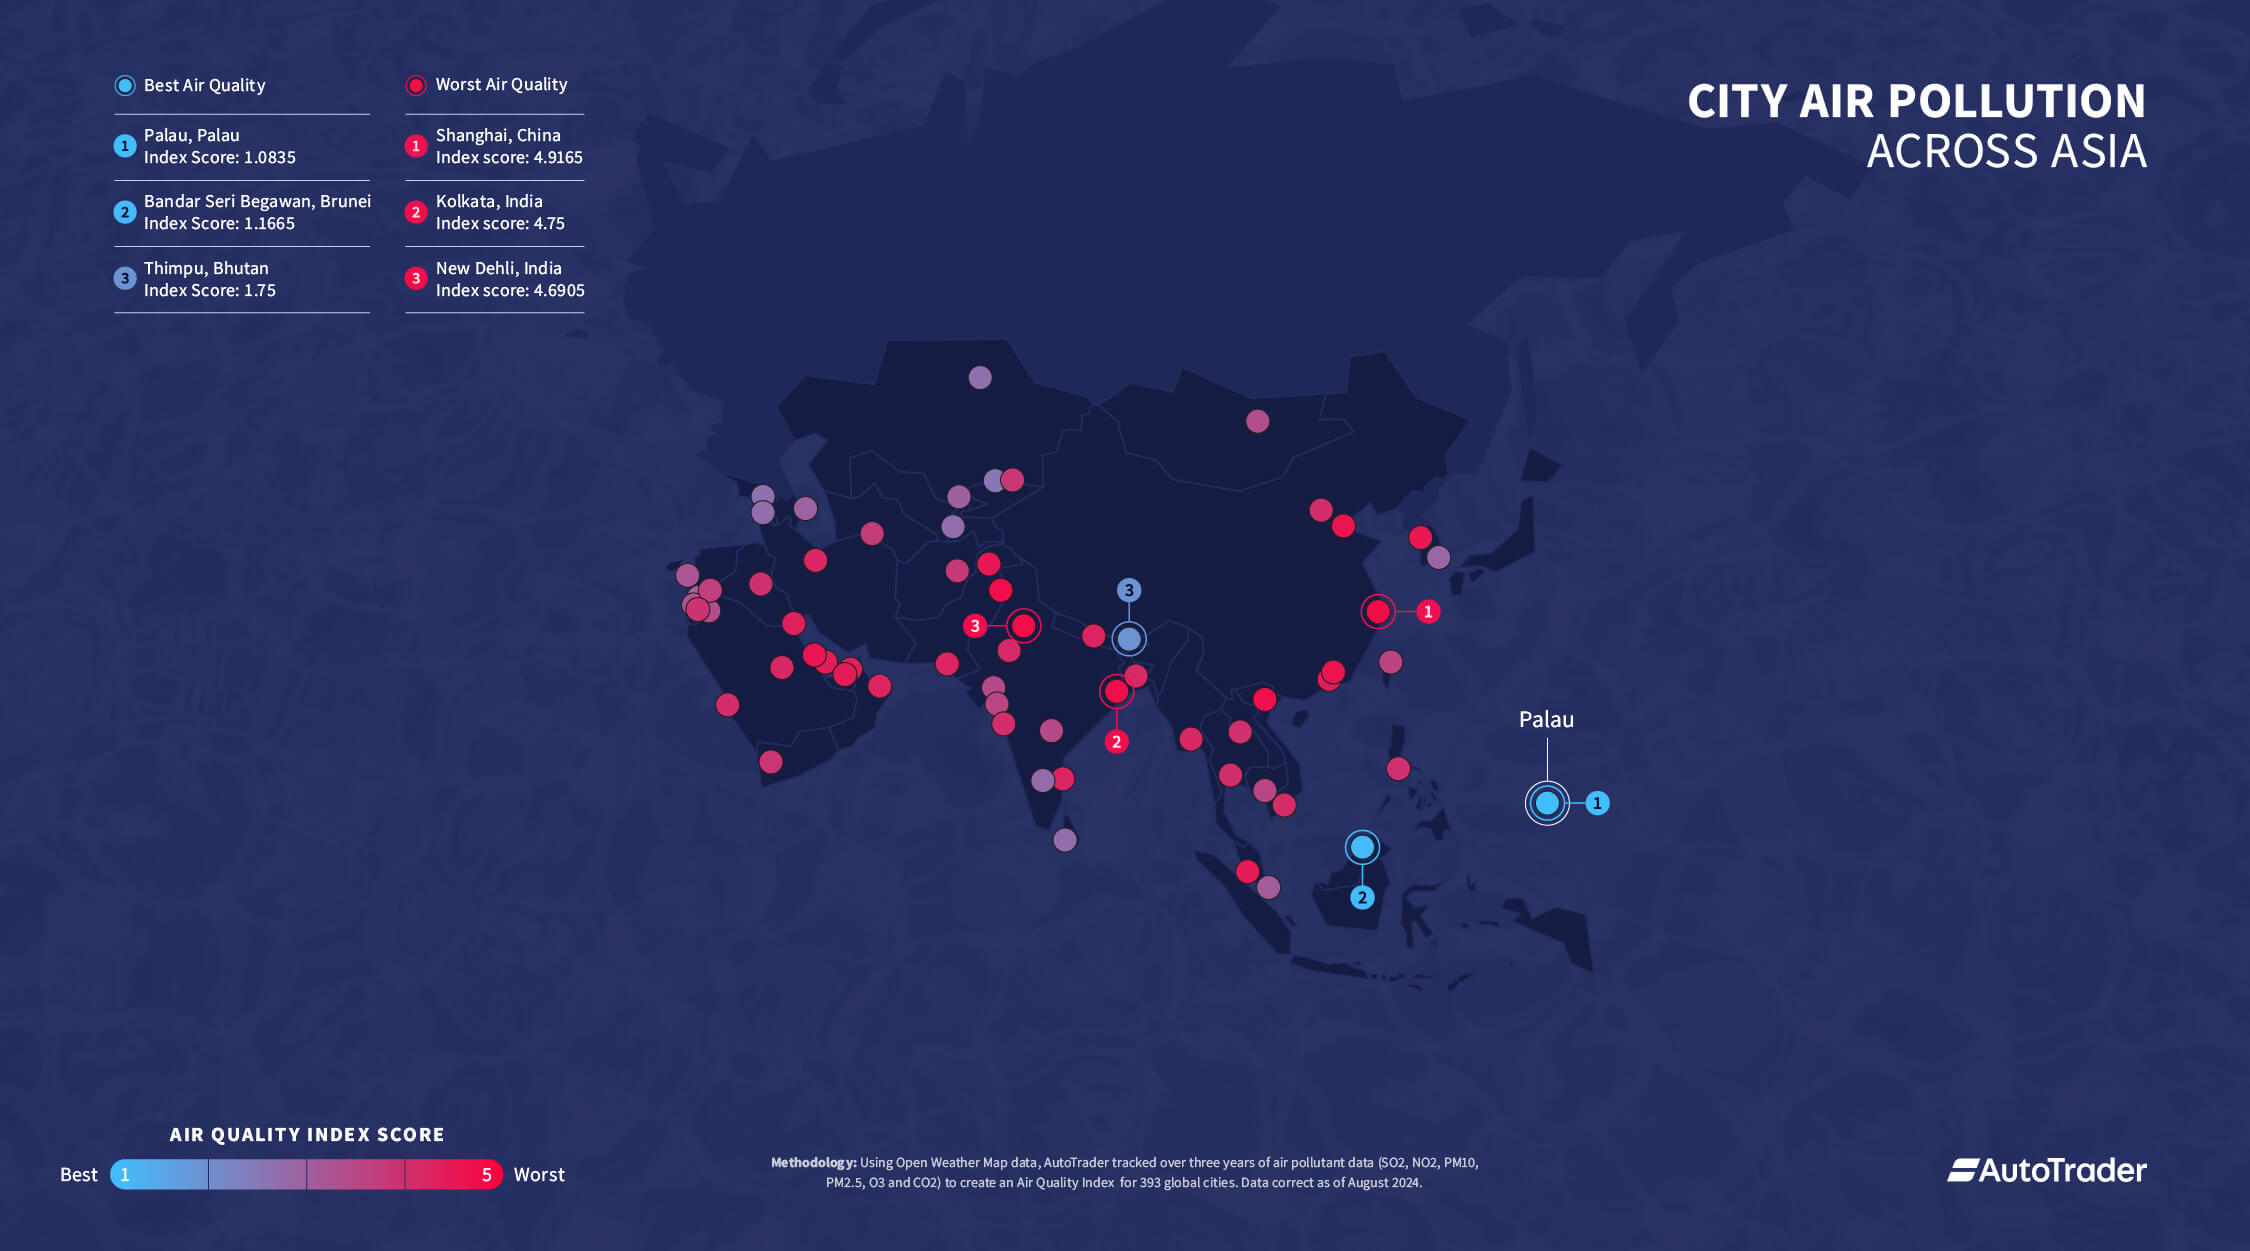
The cities with the cleanest air in Asia include Bandar Seri Begawan, Thimphu, Istanbul, Bishkek and Tbilisi in Georgia. The cleanest air city is Brunei's Bandar Seri Begawan, which has low levels of toxic air pollutants due to minimal industrial activity within the actual city (although the country is heavily reliant on oil and gas production outside of the city area). Bandar Seri Begawan is also covered by Brunei's environmental regulations aimed at protecting air quality, and the city has lower levels of traffic compared to other large cities in the same region.
Using Open Weather Map, air particle data was recorded at 6-month intervals (August and February) between August 2024 and February 2021 for 393 global cities. An Air Quality Index was created using Open Weather Maps 1-5 scale*, which ranks the cities' air from cleanest to dirtiest, where the higher the score number the dirtier and more hazardous the air quality of the city.
The concentration of pollutants tracked for this study are: Sulphur dioxide (SO2), Nitrogen dioxide (NO2), particulates (PM2.5 and PM10), Ozone (O3), and Carbon monoxide (CO) (μg/m3) The Estimated Index Change shows how much the Air Quality Index score of a city has improved or worsened over the time period tracked.
Cities tied with an Air Quality Index score have been ranked by the total number of pollutants to create a ranking of the world's cities with the cleanest air. This means that, while some cities have an equal air quality index (eg: Australia's Hobart and Darwin both have an air quality index of (1), when tallying the concentration of other air pollutants, one outperforms the other and thus ranks higher (in this case Hobart outranks Darwin).
Please note that different governments each have their own Air Quality Index equivalents, different policies on how each pollutant should be ranked against ones another, and different levels of how much of each pollutant is considered 'low' or 'high'. This research is limited to pollutant readings from 10 locations per city over 40 different dates and may be subject to sample size errors.
Sources:
| City | Country | Air Quality Index | |
|---|---|---|---|
| #1 | Funafuti | Tuvalu | 1 |
| #2 | Manaus | Brazil | 1 |
| #3 | Hobart | Australia | 1 |
| #4 | Darwin | Australia | 1 |
| #5 | Apia | Samoa | 1 |
| #6 | São Tomé | São Tomé and Príncipe | 1 |
| #7 | Nukuʻalofa | Tonga | 1 |
| #8 | Sucre | Bolivia | 1 |
| #9 | Wellington | New Zealand | 1 |
| #10 | Canberra | Australia | 1 |
| #11 | Suva | Fiji | 1 |
| #12 | Christchurch | New Zealand | 1 |
| #13 | Port Louis | Mauritius | 1 |
| #14 | Salvador | Brazil | 1 |
| #15 | Auckland | New Zealand | 1 |
| #16 | Recife | Brazil | 1 |
| #17 | Edmonton | Canada | 1 |
| #18 | Dodoma | Tanzania | 1.08 |
| #19 | Antananarivo | Madagascar | 1.08 |
| #20 | Mombasa | Kenya | 1.08 |
| City | Country | Air Quality Index | |
|---|---|---|---|
| #1 | Edmonton | Canada | 1 |
| #2 | Calgary | Canada | 1.13 |
| #3 | Madison | United States | 1.13 |
| #4 | Minneapolis | United States | 1.17 |
| #5 | Salem | United States | 1.2 |
| #6 | Augusta | United States | 1.2 |
| #7 | Montpelier | United States | 1.2 |
| #8 | Portland | United States | 1.2 |
| #9 | Austin | United States | 1.2 |
| #10 | Topeka | United States | 1.2 |
| City | Country | Air Quality Index | |
|---|---|---|---|
| #1 | Funafuti | Tuvalu | 1 |
| #2 | Hobart | Australia | 1 |
| #3 | Darwin | Australia | 1 |
| #4 | Apia | Samoa | 1 |
| #5 | Nuku'alofa | Tonga | 1 |
| #6 | Wellington | New Zealand | 1 |
| #7 | Canberra | Australia | 1 |
| #8 | Suva | Fiji | 1 |
| #9 | Christchurch | New Zealand | 1 |
| #10 | Auckland | New Zealand | 1 |
| City | Country | Air Quality Index | |
|---|---|---|---|
| #1 | Bandar Seri Begawan | Brunei | 1.167 |
| #2 | Thimphu | Bhutan | 1.75 |
| #3 | Istanbul | Turkey | 2 |
| #4 | Bishkek | Kyrgyzstan | 2.08 |
| #5 | Tbilisi | Georgia | 2.16 |
| #6 | Astana | Kazakhstan | 2.17 |
| #7 | Yerevan | Armenia | 2.25 |
| #8 | Dushanbe | Tajikistan | 2.25 |
| #9 | Colombo | Sri Lanka | 2.25 |
| #10 | Bangalore | India | 2.27 |
| City | Country | Air Quality Index | |
|---|---|---|---|
| #1 | Manaus | Brazil | 1 |
| #2 | Sucre | Bolivia | 1 |
| #3 | Salvador | Brazil | 1 |
| #4 | Recife | Brazil | 1 |
| #5 | Brasília | Brazil | 1.13 |
| #6 | Rosario | Argentina | 1.13 |
| #7 | Cartagena | Colombia | 1.2 |
| #8 | Belém | Brazil | 1.2 |
| #9 | Fortaleza | Brazil | 1.23 |
| #10 | São Luís | Brazil | 1.25 |
| City | Country | Air Quality Index | |
|---|---|---|---|
| #1 | São Tomé | São Tomé and Príncipe | 1 |
| #2 | Port Louis | Mauritius | 1 |
| #3 | Dodoma | Tanzania | 1.08 |
| #4 | Antananarivo | Madagascar | 1.08 |
| #5 | Mombasa | Kenya | 1.08 |
| #6 | Lilongwe | Malawi | 1.17 |
| #7 | Moroni | Comoros | 1.25 |
| #8 | Mogadishu | Somalia | 1.25 |
| #9 | Kigali | Rwanda | 1.27 |
| #10 | Juba | South Sudan | 1.33 |