
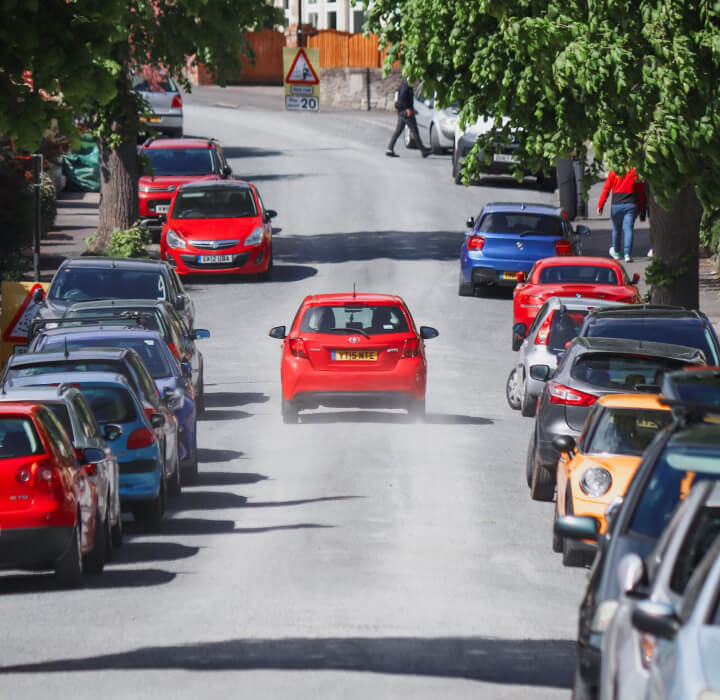

How Much Time Do You Spend in Your Car?
We know that whether you lease a car, or you own it, the time you spend in it counts. From the morning commute to the summer seaside staycation, drivers in the UK clock up thousands of miles, and hours of their time, driving for work, family, errands, fun and everything in between.
To find out how much time you spend in your car each week, and how that plays out over the year, and your lifetime, simply enter a few quick journey details into our nifty calculator below:
How do you compare to the average driver?
Drag the sliders for five journey types, and we'll show you how much time you spend in your car each year and how that stacks up against the UK average
UK drivers spend nearly 250 hours a year in their car
Our latest study reveals that UK's motorists are spending days of time in their cars over the course of a year. So, we investigated which of the nation's car journeys make up the biggest in-car time, and which drives bring us the most joy.
We commissioned a study of 1,000 motorists in the UK to find that the average driver spends 4 hours and 48 minutes behind the wheel every week, that's nearly 250 hours (roughly ten and a half days!) a year on the road.
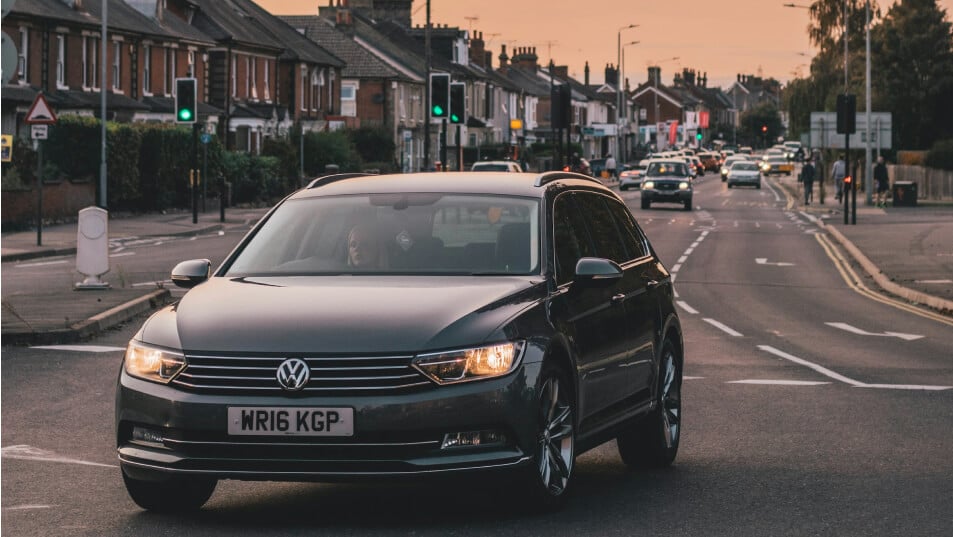
When it comes to the work commute, our previous research revealed that UK drivers could be spending the equivalent of over seven days a year in their car driving to and from work. Our latest research shows that the UK average commute is 35 minutes long and that the journey to work typically occurs three to four days a week. Meanwhile, 29% of parents and guardians around the UK are facing a 28-minute drive to school five days a week, which quickly eats up nearly ten hours a month.
With all these little journeys stacking up, and longer drives to visit family and friends, or driving to go on holiday also taking place a few times a year, it is easy to see how the time spent in our cars quickly turns into days and weeks over the course of a year.
We found that the longest regular drive most of us undertake isn't the commute to work, but visiting the people we love. Hitting nearly an hour of driving time, trips to see friends and family contribute to clocking up plenty of miles, alongside the everyday errands.
Average driving time and frequency for common car trips in the UK
| Journey Type | Average Trip | Frequency |
|---|---|---|
| Health appointments | 27 minutes | ~ 1 x a week |
| School run | 28 minutes | ~ 3 x a week |
| Shopping & errands | 32 minutes | 2–3 x a week |
| Hobbies & activities | 33 minutes | 2 x a week |
| Commute to work | 35 minutes | 3–4 x a week |
| Visiting friends & family | 56 minutes | ~ 2 x a month |
| Staycation holiday | 4 hours (one way) | 3 x a year |
The UK’s favourite car journeys

Whilst the journeys of necessity naturally scored lower enjoyment levels, when it comes to the weekly admin drives, going to the shops and running errands is the most preferred car journey, compared to the school run, health appointments and work commute.
At the most enjoyable end of the spectrum, one in five drivers (21%) say visiting friends and family is their favourite type of drive, which is followed by driving to a holiday destination in close second (20%).
But whether it's picking up the kids, or driving to a well-deserved break away, our findings show that the car journey itself, not just the destination, can be a meaningful part of life for British drivers:
Why we love car journeys:
- 39% say it helps them relax and unwind
- 38% enjoy the scenery
- 37% like the sense of purpose the journey gives them
- 26% value time with family and kids in the car
The least enjoyable journeys highlighted in our study are health appointments and the daily drive to work. But besides the reason for the drive (26%), motorists revealed the other most off-putting parts of weekly car journeys are:
- 31% usually find weekly drives are busy or congested
- 26% find weekly drives feel like a chore
- 26% find weekly drives boring and repetitive
- 24% find weekly drives stressful or frustrating
Happily, a significant part of the UK's driving population (30%) say they don't find any drive to be the least enjoyable, suggesting that the nation has a fundamentally positive relationship with driving and spending time in their car.
Where in the UK spends the longest and shortest amount of time in their car
When it comes to the total time spent in the car each week, Cardiff tops the UK table. Drivers in the Welsh capital clock up on average an impressive six and a half hours behind the wheel, nearly two hours more than the national average.
At the other end of the scale, drivers in Liverpool take the crown for the least time spent in their cars, averaging just 3 hours and 12 minutes a week.
When it comes to the daily commute, Glasgow has the longest average round trip to work at 40 minutes long. Leeds sits at the opposite end with the shortest commute in the UK, with drivers spending just 25 minutes on average behind the wheel to get to work. But it's Belfast and Sheffield where drivers are most reliant on their cars to get to work; both cities see drivers commuting by car four or more days a week, which is above the national average of 3.5.
Bristol stands out as the city with the toughest school run in the country, with parents spending an average of 38 minutes a day on the trip, nearly ten minutes longer than the UK average. Plymouth parents, on the other hand, have the shortest school run at just 21 minutes.
However, whilst Plymouth's school run is speedy, when it comes to visiting friends and family, Plymouth drivers face some of the longest social journeys in the UK, averaging 77 minutes per trip. Norwich isn't far behind at 70 minutes, suggesting that for drivers in these areas, staying connected with loved ones means a serious commitment of time spent in their car.
How the UK measures up against the rest of the world

Whilst UK motorists might feel like they spend their lives in their car, by global standards the UK is one of the least car-dependent nations in the world. UK drivers self-reported that they spend on average 4 hours and 48 minutes a week in their car, which lands them 14th in the international table.
Top Fifteen
Average Total Time Spent in Car Each Week
| Rank | Country | Hours: Minutes |
|---|---|---|
| #1 | South Africa | 10:38 |
| #2 | Ireland | 7:23 |
| #3 | Australia | 7:08 |
| #4 | Canada | 6:50 |
| #5 | Italy | 6:17 |
| #6 | Greece | 6:13 |
| #7 | New Zealand | 5:58 |
| #8 | USA | 5:55 |
| #9 | Portugal | 5:50 |
| #10 | Spain | 5:24 |
| #11 | Germany | 5:21 |
| #12 | Poland | 5:11 |
| #13 | France | 5:10 |
| #14 | UK | 4:48 |
| #15 | Netherlands | 4:38 |
South Africa spends the longest time behind the wheel each week
Drivers in South Africa spend more than 10 hours and 38 minutes in their cars every week, which is more than double the British average and nearly three hours more than Ireland, which takes second place. Despite its relatively small size, Ireland comes out as a nation with a high drive time, spending on average 7 hours and 23 minutes a week in their car, with Australia in third at 7 hours and 8 minutes on average.
When diving into more detailed answers, the data shows that South African drivers top the table for the longest time spent in their cars doing the school run (1 hour 14 minutes a week), visiting friends and family (1 hour 53 minutes a week) and everyday errands (1 hour 36 minutes a week). The average weekly total commute time in South Africa is 1 hour 48 minutes which is second highest across the countries surveyed, just one minute behind Australia (1 hour 49 minutes a week).
Ireland punches well above its weight when it comes to time spent in the car. With the second highest weekly average of all countries surveyed, our data shows that Irish drivers are some of the world's most committed commuters, spending 1 hour 46 minutes a week driving to and from work. The school run seems equally demanding for Irish motorists, taking on average a full hour a week, and using the car for shopping, appointments and other errands taking up 1 hour and 27 minutes each week.
Australian drivers self-report that on average they spend 7 hours and 8 minutes in total in their car each week. They have a punchy commute time, the longest on average in the world, reporting that they spend 1 hour 49 minutes each week driving to work. Australians also report they spend 56 minutes a week on average doing the school run and 1 hour 15 minutes a week in the car running errands.
Despite their weekly average drive time for commutes and errands being lower than the other countries, motorists in Germany and France report the highest average time spent driving to vacation destinations. The average total time spent driving to a holiday destination for German drivers each year is 10 hours 26 minutes, and for French drivers each year it's 9 hours 59 minutes. This suggests that while drivers from Germany and France may be disciplined about their day-to-day driving time, they are fully embracing the open road and the opportunities of being in mainland Europe when it comes to a holiday road trip.
The right car for every type of journey
Whilst navigating rush hour, singing along to the radio on the way to a friend's house or listening to how a day of school went, UK drivers are clocking up 250 hours in their car each year. With so much of life happening behind the wheel, the car you drive matters, for the big journeys and the little ones in between. Leasing through Autotrader gives you the flexibility to choose a car that genuinely fits how you drive through life.
Methodology
For the UK study Autotrader commissioned research conducted by Censuswide among a sample of 1,000 UK drivers, asking them to self-report on how much time they spend on individual car journeys as well as their average weekly driving time.
Using global consumer research platform Prolific, Autotrader surveyed drivers across 15 countries to compare self-reported average driving times. Respondents were also asked about the average time they believe they spend on individual journeys such as the work commute, school run, errands, holidays and social visits. Results are shown as national averages.
All data was collected in April 2026.